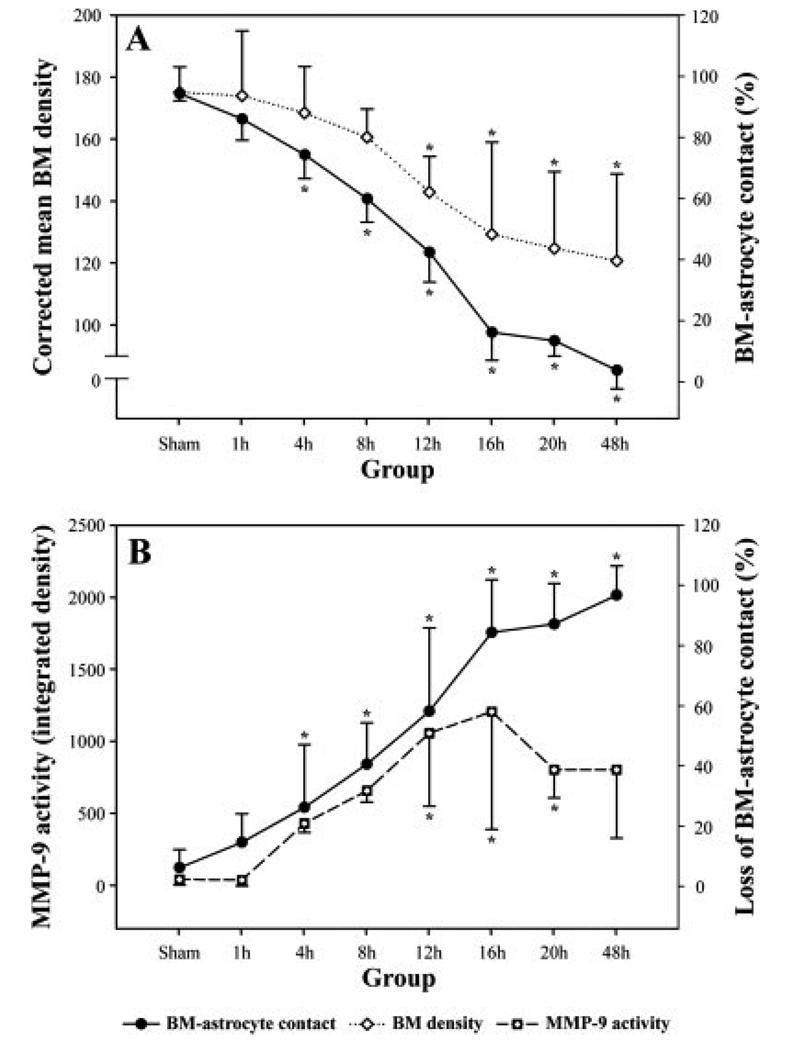
Fig. 3.
The temporal pattern of changes in the basement membrane (BM)–astrocyte contacts, BM electron densities, and MMP-9 activities at each time point after the middle cerebral artery occlusion (MCAO). Solid lines indicate the percentage of microvascular surface attached (A)/detached (B) to the enveloping astrocyte endfeet. The decrease is significant 4 hr after MCAO and thereafter compared with the sham-operated group. The BM density is significantly decreased at 12 hr and is further decreased until 48 hr. Changes in the BM–astrocyte contacts and BM densities appear parallel. The loss of contacts and the increase of MMP-9 activities also show a parallel pattern, particularly from 4 hr to 12 hr after MCAO. ★P < 0.05, significantly different from the sham.

