Fig. 1.
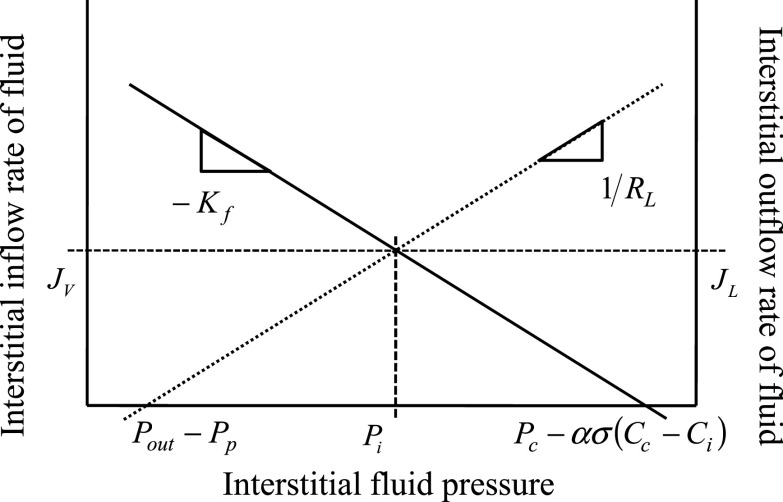
Graphical representation of the balance point concept applied to interstitial fluid flow. Continuous line represents the Starling-Landis relationship (Eq. 2) (41, 47), which predicts that as interstitial pressure (Pi) increases, transmicrovascular flow into the interstitium (JV) decreases. The dotted line represents the Drake-Laine relationship (Eq. 4) (12), which predicts that as Pi increases, lymph flow from the interstitium (JL) increases. Their intercepts represent equilibrium, where flow into the interstitium is equal to flow out of the interstitium (i.e., Jv = JL). Dashed lines represent the steady-state values of Pi, JL, and JV, explicitly expressed by Eq. 8a. Intercepts and slopes are related to effective fluid-driving pressures and resistances to fluid flow. 1/Kf is the effective resistance to flow into the interstitium and RL is the effective lymphatic resistance. Pc − ασ(Cc − Ci) represents the total effective pressure forcing fluid into the interstitium, where Pc is the capillary hydrostatic pressure and Cc − Ci is the difference between capillary and interstitial protein concentrations. Pout − Pp represents the total effective pressure hindering flow from the interstitium, where Pout is the lymphatic system outlet pressure (presumably central venous pressure) and Pp is the effective lymphatic pumping pressure.

