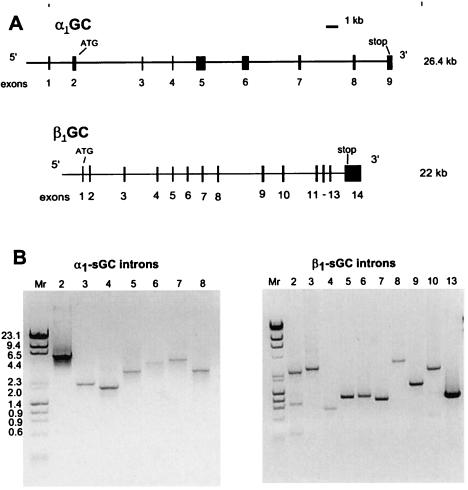
Figure 1.
Genomic structure and size of introns of murine α1 and β1 sGC. (A) Exon-intron distribution of murine α1 and β1 sGC genes (drawn to scale). Exons are represented by black boxes. (B) Estimation of the intron sizes by PCR using primers located in cDNA sequences flanking the introns (see Materials and Methods). The amplified DNA products were separated on 1% agarose gel and stained with ethidium bromide. The molecular mass markers (mixture of Lambda DNA–HindIII digest and φX174 DNA–HaeIII digest, New England Biolabs) are shown at the left of each panel.

