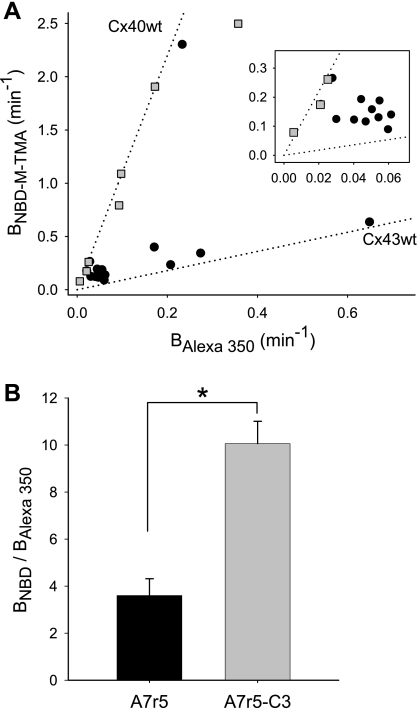
Fig. 7.
Charge selectivity of junctions formed by cells coexpressing Cx43 and Cx40 at different expression ratios. A: plot of BNBD-M-TMA vs. BAlexa 350 for A7r5C3 ( ) and A7r5 (•) cell junctions (dotted lines are the linear regression fits for Cx40 and Cx43 junctions as shown in Fig. 2A). Inset shows data near graph origin at expanded scaling of both axes. B: the average charge selectivities (BNBD-M-TMA/BAlexa 350) of A7r5 and A7r5-C3 junctions are significantly different, P < <0.001. *Selectivity of A7r5-C3 junctions significantly greater than A7r5 junctions (Student's t-test).

