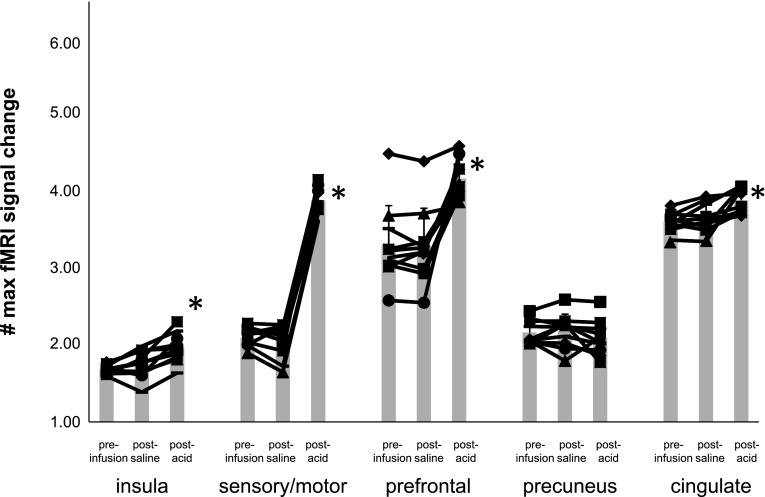
Fig. 6.
Comparison of regional brain activity is shown comparing the percent maximum fMRI signal change preinfusion and after saline and esophageal acid exposure in each healthy control subject. There were significant differences (*P < 0.05) in the insula, sensory/motor, prefrontal, and cingulate regions following acid exposure but not after saline infusion.

