Fig. 3.
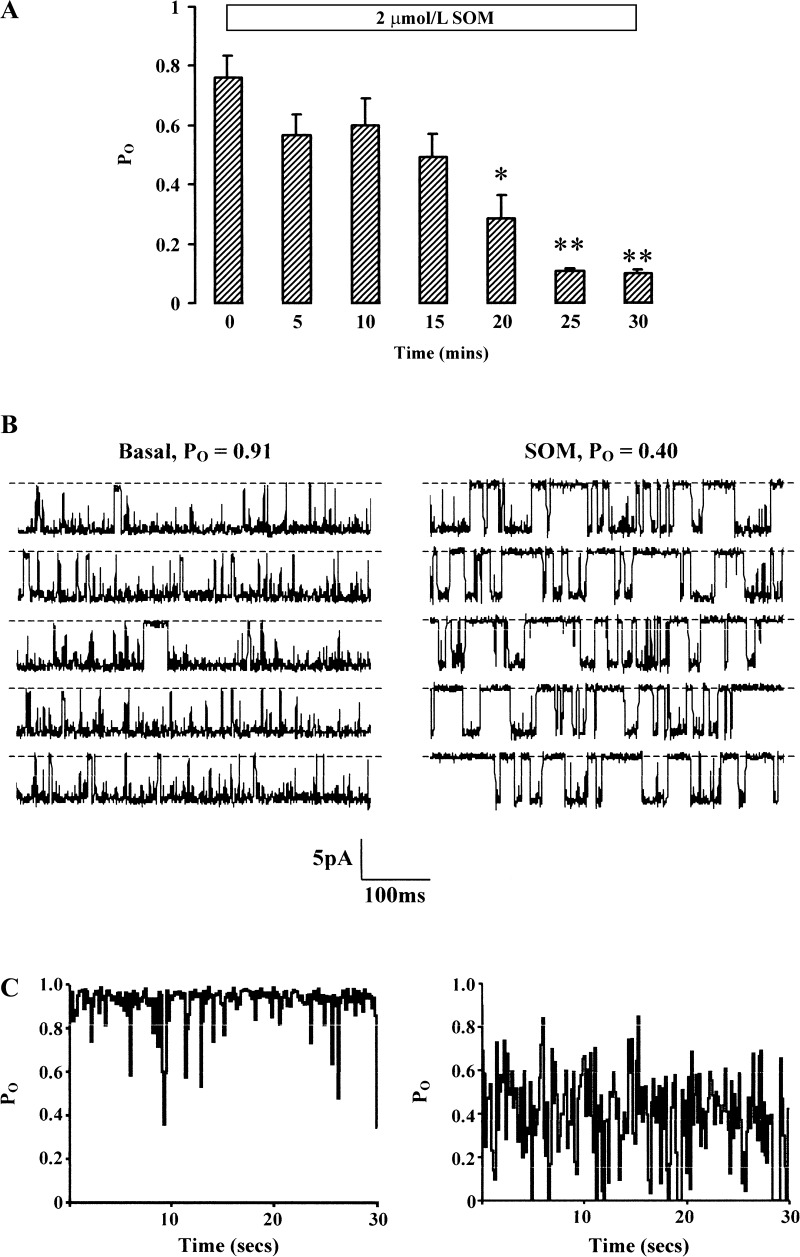
Effect of 2 μmol/l somatostatin (SOM) on BK channel activity. A: time course of SOM-induced inhibition of channel activity in 7 cell-attached patches in surface colonocytes (140 mmol/l NaCl in bath and 145 mmol/l in pipette, command voltage = 0 mV). Mean data ± SE are shown. *P < 0.02 and **P < 0.001 compared with t = 0 by ANOVA. B: representative 3-s segments from 30-s recordings from single patch containing 1 spontaneously active BK channel in the basal state (left) and after 25-min exposure to SOM. C: sustained inhibition of channel activity (Po) produced by SOM during the entire 30-s recordings represented in B.

