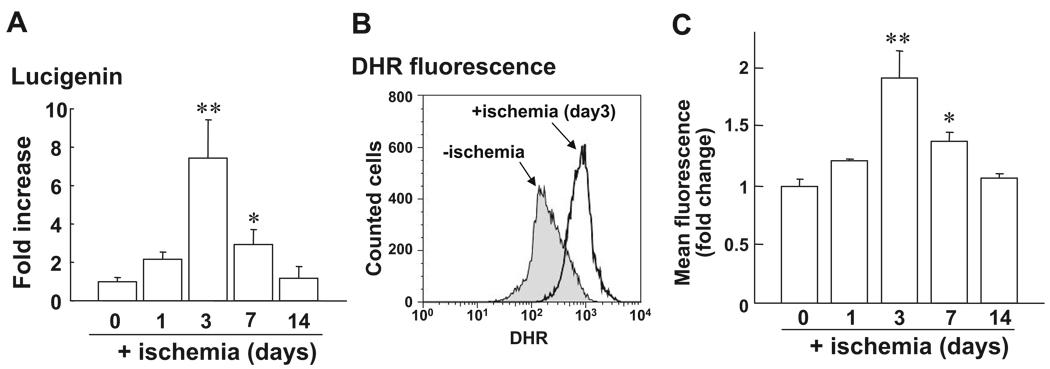
Figure 1.
Increase of ROS production in BMCs after hindlimb ischemia. Low-density BM-MNCs (BMCs) were separated by Histopaque 1077. A, O2∙− production in BMCs after hindlimb ischemia on postoperative days 0, 1, 3, 7, and 14, as measured by lucigenin-enhanced chemiluminescence technique (n=4 in each time point). B, Dihydrorhodamine 123 (DHR) fluorescence in BMCs after hindlimb ischemia is measured by FACS analysis. Upper panel shows the representative histogram of fluorescence intensity, expressed by the logarithum (x axis) on 0 and 3 days after ischemia. Lower panel shows the averaged data, expressed as fold change of fluorescence over basal (the ratio on day 0 was set to 1) on various postoperative days (n=4, **P<0.05, **P<0.01 vs day 0).

