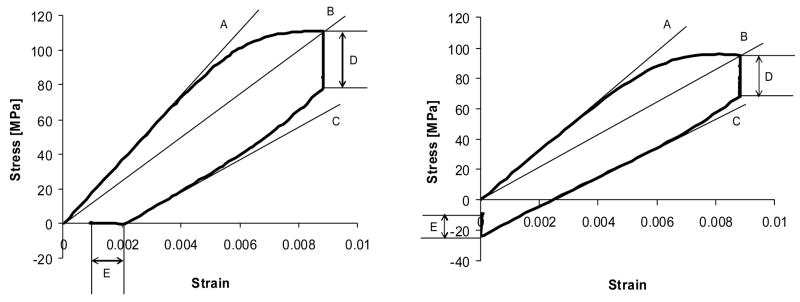
Figure 3.
Stress-strain curve for typical damage cycles of zero-stress hold condition (left) and zero-strain hold condition (right). Thin lines represent measured mechanical properties: Loading modulus (slope of A), Secant modulus (slope of B) and Unloading modulus (slope of C), Stress relaxation (D), Strain recovery (E on left graph) and Stress recovery (E on right graph). These same mechanical properties were also measured for pre and post-damage diagnostic cycles.

