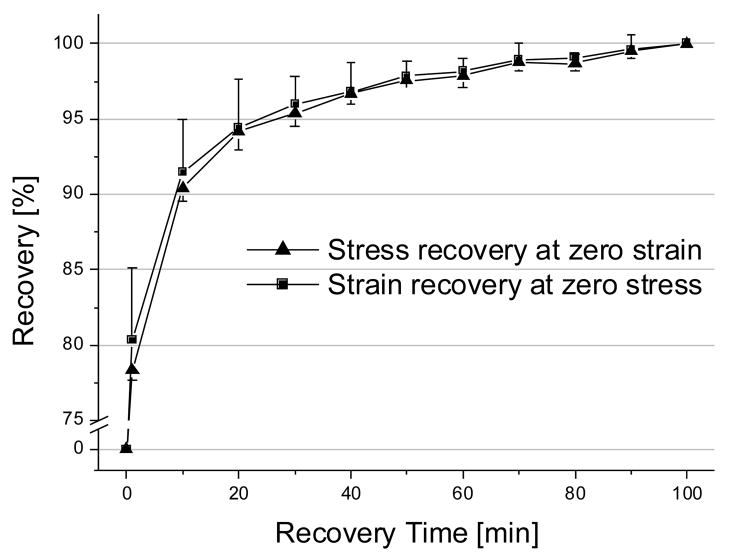
Figure 8.
Histories of stress recovery (zero-strain hold group) and strain recovery (zero-stress hold group) during 100 minutes recovery period after damage cycle. Note the data were normalized to the maximum recovery value of each group. Recovery of strain and stress were similar to each other after 10 minutes of recovery time. All values are mean±SD (n=8). The curve fitting showed y = 79.356x0.0519, R2 = 0.9831 for stress recovery; y = 81.229x0.0468, R2 = 0.9858 for strain recovery, where x is recovery time in seconds, and y is percent decrease in residual stress or strain

