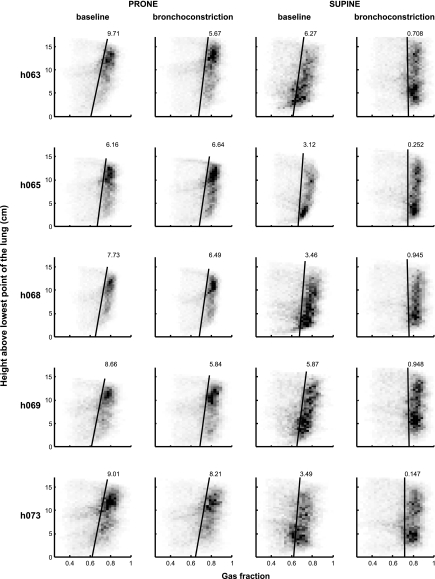
Fig. 6.
Fgas gradients in the four conditions: prone baseline, prone bronchoconstriction, supine baseline, and supine bronchoconstriction. The gray scale of the squares in the plots corresponds to the number of data points with that value, such that the darker the square, the greater the number of points with that value. The linear regression line (solid black) is shown, and the number at the top of each line is the gradient (×10−3 cm−1) for each plot. Note the larger gradient in the prone position compared with supine at baseline, which changes little during bronchoconstriction. In contrast, the Fgas gradient changes substantially in the supine position during bronchoconstriction compared with baseline.

