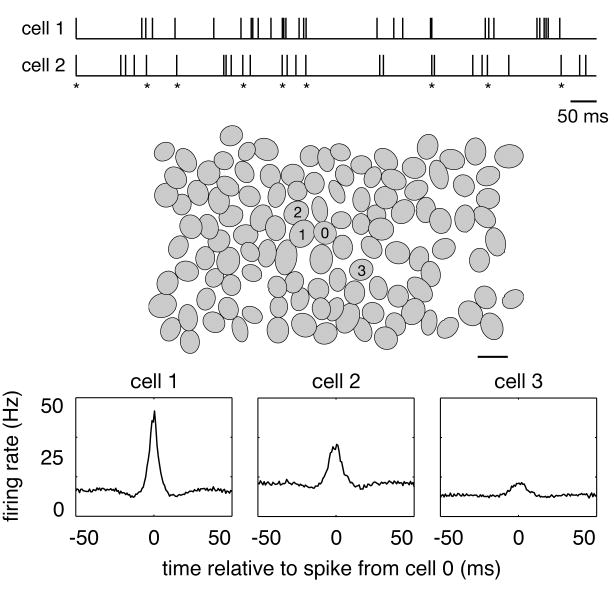
Figure 1.
Synchronized firing in primate retinal ganglion cells [46]. The top traces represent spike trains from two ON parasol cells. Asterisks mark moments in time when both cells fired nearly simultaneously (±5 ms). The middle panel shows a recording of a complete population of ON parasol cells. Each oval represents the 0.9 standard deviation contour of a Gaussian fit to the receptive field of one cell (scale bar, 200μm). The magnitude and time scale of synchronized firing between the center cell (0) and three neighbors (1,2,3) is revealed by their cross-correlograms (bottom panels), which shows the firing rate of center cell as a function of time relative to the occurrence of a spike in the other cell. The height and width of the central peak indicate the magnitude and time scale of synchronized firing between each pair of cells. Note that the magnitude of synchronized firing decreases systematically with the distance between cells.

