
Figure 6. Parvalbumin and Calbindin Expression.
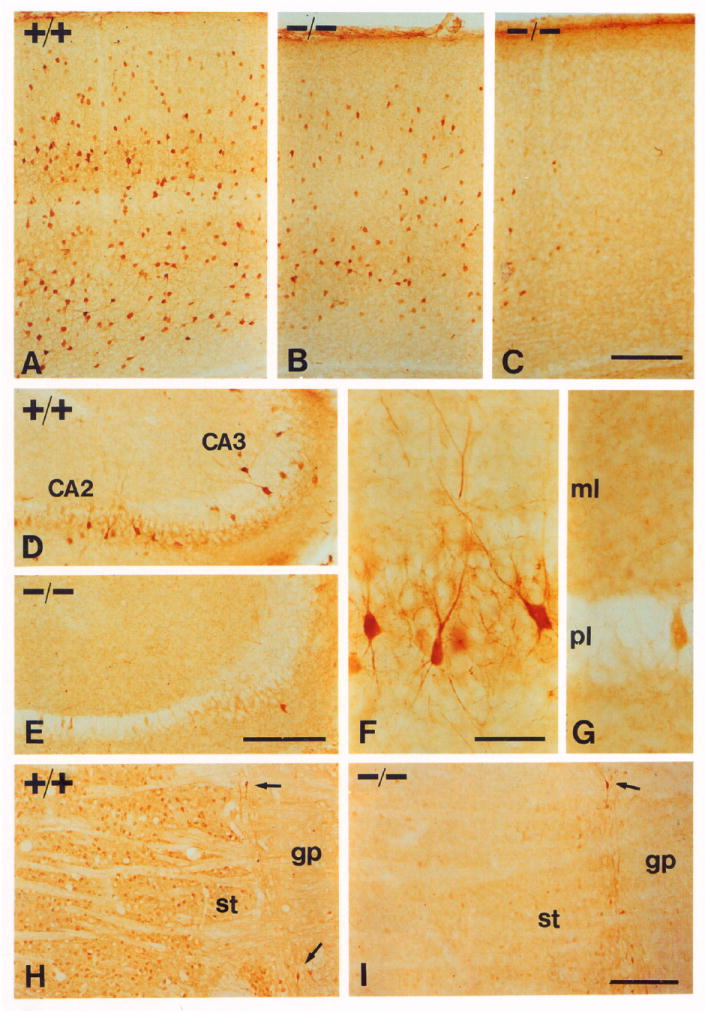
Sections from P17 mice stained with parvalbumin (A–G) or calbindin-D28K (H and I) antibodies.
(A–C) Parvalbumin staining in the cerebral cortex.
(A) Somatosensory cortex from a wild-type mouse.
(B) The same area from a −/− mouse.
(C) Occipital visual cortex from a −/− mouse.
(D–G) Hippocampus sections from a +/+ mouse (D and F) and from a −/− mouse (E and G), documenting absence of neurons expressing parvalbumin in a −/− mouse. Abbreviations: ml, molecular layer; pl, pyramidal cell layer.
(H and I) Calbindin staining in the striatum (st) of +/+ (H) and −/− (I) mice, showing that the reduction is almost complete. Positive neurons between the globus pallidus (gp) and the striatum (arrows) appear the same.
Scale bars, (A–E) 200 μm; (F and G) 50 μm; (H and I) 200 μm.