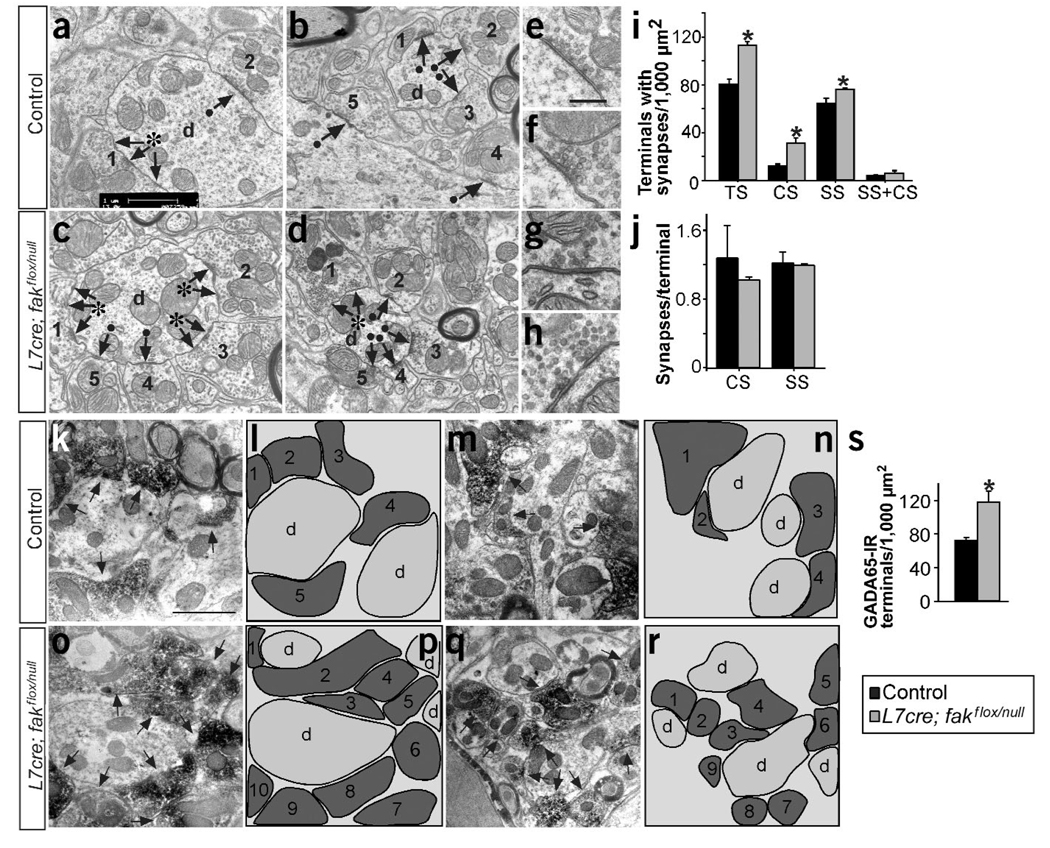
Figure 2.
Numbers of Purkinje cell axon terminals and synapses are increased in the DCN of L7cre;fakflox;faknull conditional mutant mice. (a–d) Fine structure of several representative fields in the DCN, showing terminals arriving and making synapses on the dendrite. Arrows indicate synaptic densities. Black dots indicate simple (1 synaptic density) and asterisks indicate complex (>1 synaptic density) synapses. Numbers identify the axonal terminals. d, dendrite. (e–h) Higher magnifica-tion images showing organization of the vesicles in the synaptic densities in the DCN. (i) Quantification of the number of terminals per 1,000 µm2 containing different types of synapse (CS, complex; SS, simple; TS, total). *P < 0.01 to P < 0.001 versus control by ANOVA (control, 80.06 ± 4.24 TS, 12.25 ± 1.19 CS, 64.01 ± 4.40 SS; mutant, 112.57 ± 2.95 TS, 30.97 ± 4.84 CS, 75.60 ± 4.77 SS; n = 4). (j) Quantification of complex and simple synapses per terminal. (k–r) Electron micrographs showing representative fields, and schematic drawings of GAD65-immunoreactive (IR) axonal terminals in the DCN. Arrows indicate GAD65-IR axonal terminals. (s) Quantification of GAD65-IR terminals. *P < 0.05 versus control (control, 71.66 ± 3.58, n = 3; mutant, 117.61 ± 12.98, n = 4). Data are the mean ± s.e.m. Scale bars, 1 µm (a–b,k–r); 0.5 µm (e–h).

