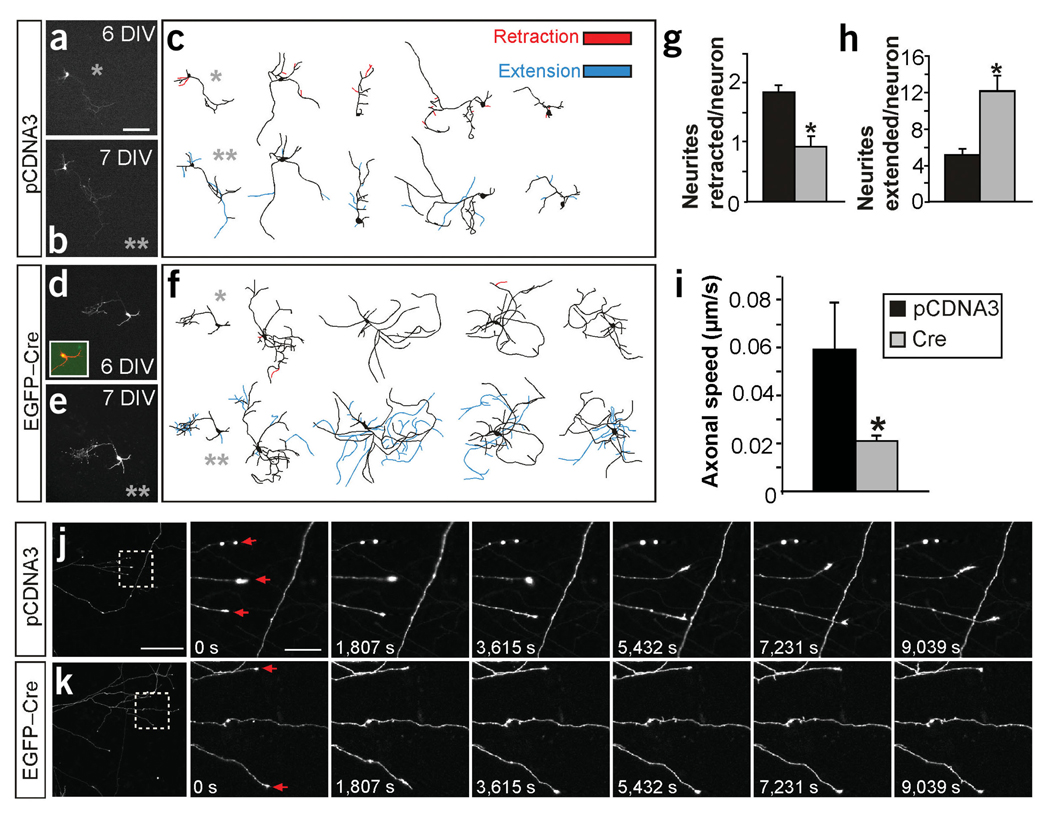
Figure 5.
Axonal branch dynamics of hippocampal neurons in absence of FAK. (a–h) Time course recording of the same neuron at 6 and 7 DIV. (a,c,d,f) In vitro fluorescence images and representative drawings of neurons transfected with control pCDNA3 (a,c) or EGFP-Cre (d, f) plasmids at 6 DIV. (b,c,e,f) Images of the same neurons after 1 d (7 DIV). Inset in d shows colocalization of DsRed (red) and EGFP-Cre (green). Gray asterisks identify the drawing of the neurons shown in the adjacent photomicrographs. Neurites undergoing retraction at 7 DIV are shown in red in the 6-DIV drawings. The new extended neurites at 7 DIV are shown in blue in the 7-DIV drawings. (g) Quantification of the number of neurites retracted per neuron in the time course experiments. *P < 0.03 versus control by two-tailed t-test (control, 1.86 ± 0.11; mutant, 0.92 ± 0.18). (h) Quantification of the neurites extended per neuron in the time course experiments. *P < 0.001 versus control (control, 5.07 ± 0.74; mutant, 12.07 ± 1.7; n = 30 neurons from three independent experiments in g and h). (i) Quantification of the growth cone advance rate expressed in µm progressed per s. *P < 0.04 versus control (control, 0.05 ± 0.019; mutant 0.02 ± 0.002; n = 93 axons from control neurons and 125 axons from Cre-transfected neurons from two independent experiments). (j,k) In vivo time-lapse imaging of the same axonal branch recorded over 3 h at 15-min intervals. Left image, low-magnification of axonal branches from the pCDNA3 and DsRed (j) and the EGFP-Cre and DsRed (k) cotransfected neurons. Right images, boxed areas in j and k shown as higher magnification time-lapse sequences. Note that, as in Figure 4, most branching neurites at these stages are developing axons (∼95%), although a few of them could be dendrites. Data are the mean ± s.e.m. Scale bars, 150 µm (a–f and j,k, left image); 25 µm (j, k, right images).

