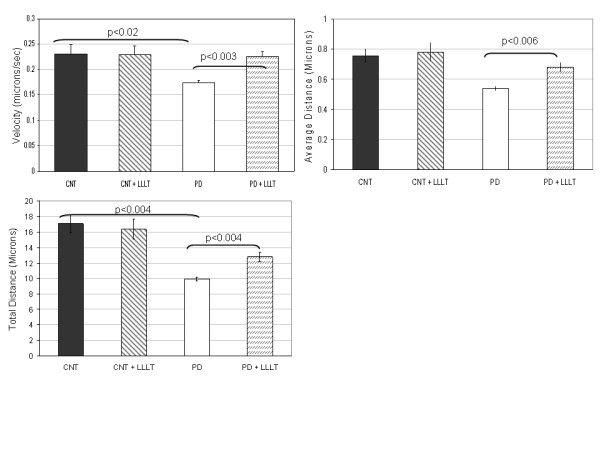
Figure 2.

This figure contains three graphs. Graph 2A depicts the average velocity of mitochondrial movement in the processes of CNT (n = 5), CNT+LLLT (n = 5), PD (n = 6) and PD+LLLT (n = 6) cybrid neuronal cell lines. Using a two-tailed t-test assuming unequal variance, mitochondrial movement in PD cybrid neurites was significantly reduced compared to CNT. Mitochondrial movement in PD+LLLT cybrid neurites was significantly increased compared to PD. Mitochondrial movment in CNT cybrid neurites was not significantly different from CNT+LLLT. Differences in culture conditions, cell type, mitochondrial labeling method and method of velocity calculation make it difficult to compare mitochondrial velocities among published papers. Graph 2B depicts the average distance traveled by mitochondria during the recording period. The average distance traveled by mitochondria (calculated by averaging the distance traveled for each three second interval irrespective of direction of travel) in PD+LLLT was significantly increased above PD. Graph 2C depicts the total distance traveled (calculated by summing the distance traveled in each three second interval irrespective of direction of travel) during the recording period by mitochondria in each category. The total distance traveled by PD mitochondria was significantly reduced compared to CNT. The total distance traveled by PD+LLLT mitochondria were significantly increased compared to PD.
