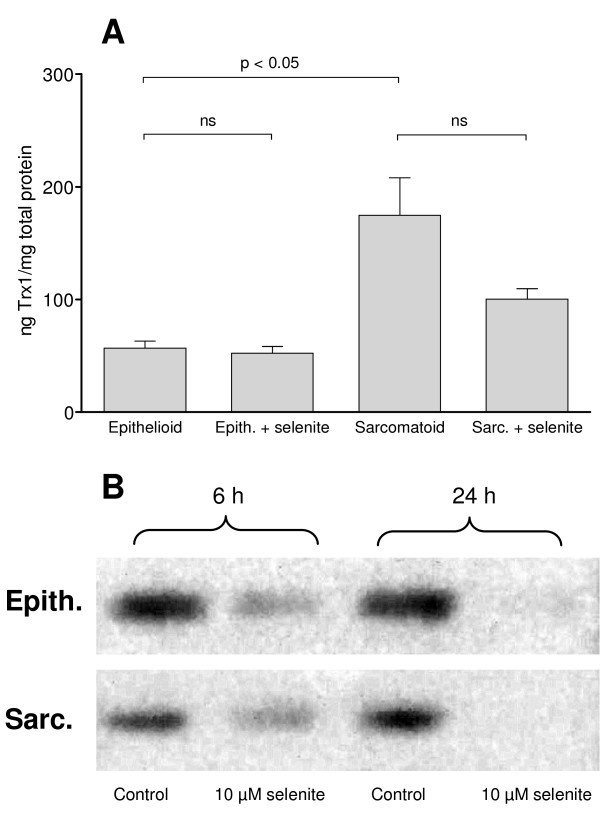
Figure 3.
Thioredoxin levels and p53 activity. A: Amount of thioredoxin relative to total protein amount after 24 h. B: EMSA for p53 demonstrating less DNA-binding activity of p53 after selenite treatment in both cell types, but more markedly so in the epithelioid cells. Bars indicate the standard error of the mean. Student's t-test was performed. ns = not significant. Three independent experiments were performed.

