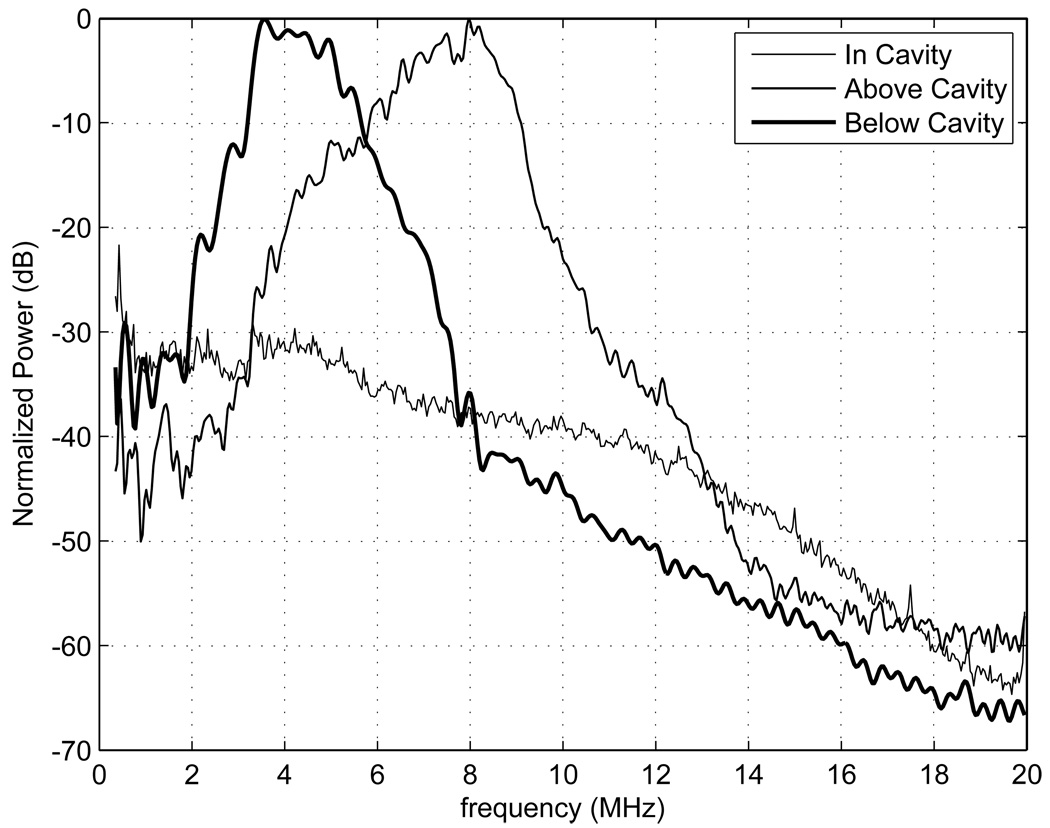
Figure 17.
Power spectra generated from RF data taken using the second uterine phantom and the Siemens Antares VFX 13-5 transducer operated at 9 MHz in, above, and below the uterine cavity. The power spectrum in the cavity was normalized to the maximum value of the spectrum above the cavity. The power spectrum in the uterine cavity shows that there is presumably electronic noise detected, which leads to significant strain image noise within the cavity. The power spectra proximal and distal to the uterine cavity show a decrease in bandwidth with depth.

