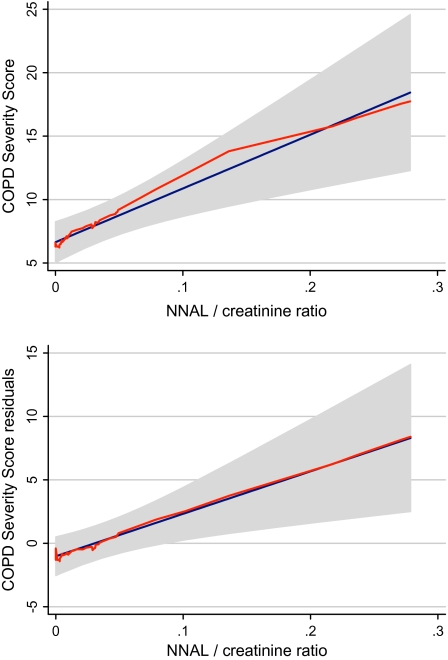
Figure 2.
Longer term secondhand smoke exposure and chronic obstructive pulmonary disease (COPD) severity. (a) Locally weighted regression scatter plot smoother (LOWESS) procedure was used to graphically depict the relationship between 4-(methylnitrosamino)-1-(3-pyridyl)-1-butanol (NNAL)-to-creatinine ratio and COPD severity score in a flexible manner (shown in orange). The blue line is the fitted linear regression line. The gray area shows the 95% CI. (b) LOWESS plot of COPD severity score residuals that adjust for age, sex, race, educational attainment, and smoking history, and NNAL-to-creatinine ratio (orange line). The blue line is the fitted linear regression line. The gray area shows the 95% CI.

