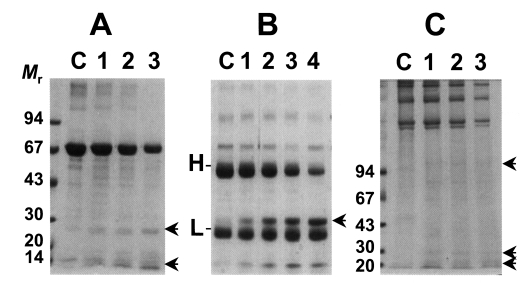
Fig. 2.
Degradation of macromolecules by the purified cysteine protease. Mr, standard marker protein. Panel A, degradation of BSA. Lane C, control BSA; lanes 1-3, 1, 3, 5 hr incubation with purified cysteine protease, respectively. Arrows indicate degradation products. Panel B, cleavage of human IgG. Lane C, control IgG; lanes 1-4, 1, 3, 5 hr and overnight incubation with the enzyme, respectively. H & L denote heavy and light chain of IgG. Arrow indicates degradation product of IgG. Panel C, degradation of Type I collagen. Lane C, control collagen; lanes 1-3, 1, 3, 5 hr incubation with the enzyme, respectively. Arrows indicate degradation product of collagen.

