
Figure 7.
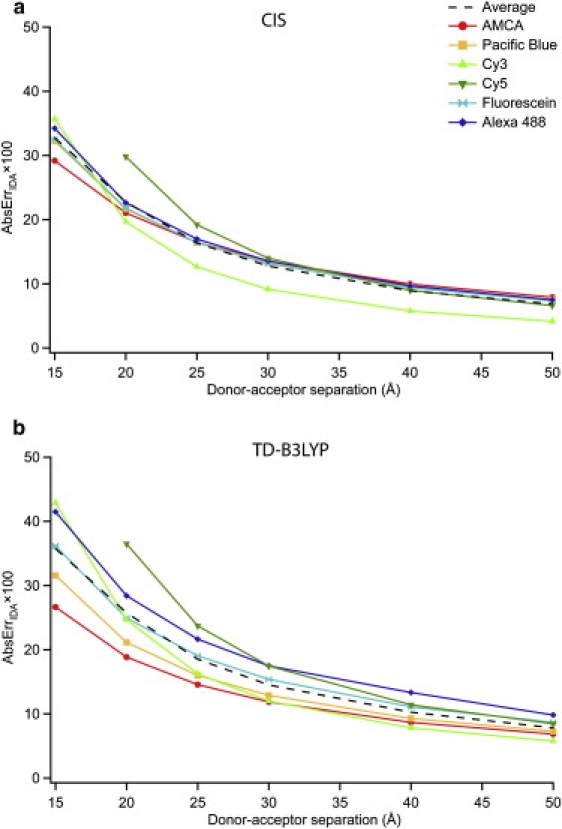
Average absolute relative error in the IDA (AbsErrIDA) for orientationally averaged homodimers of each molecule examined as a function of distance. Graphs a and b refer to CIS and TD-B3LYP results, respectively. These curves are generated from the same data used to generate Fig. 3, but have been calculated using Eq. 8 rather than Eq. 7.