
Figure 7.
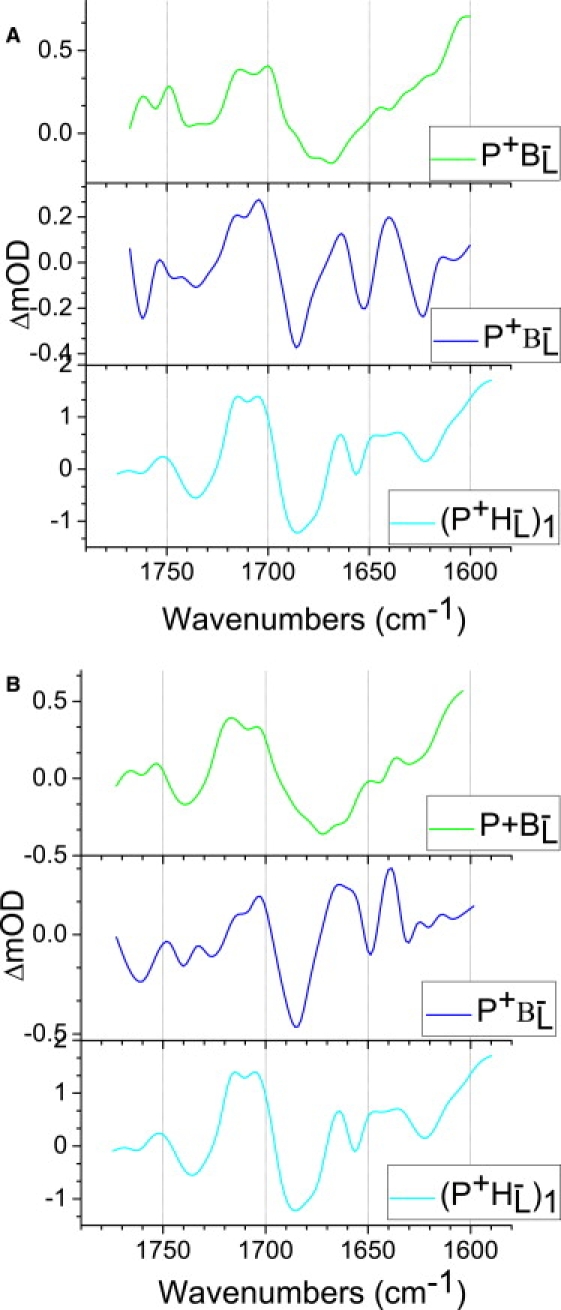
Comparison of the P+BL− and P+βL− SADS resulting from target analysis of the LM214H RCs (green and blue, respectively) and (P+HL−)1 SADS from target analysis of R-26 QA-depleted RCs (cyan): plot A— upon excitation with 805 nm; plot B—average of four P+BL− and P+βL− SADS compared with (P+HL−)1 SADS upon 805 nm excitation.