
Figure 11.
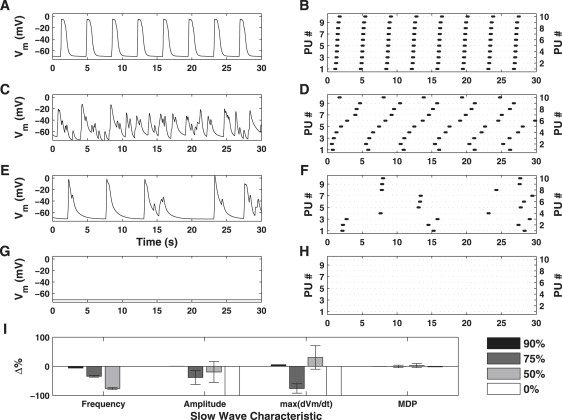
Simulated dose-response effects of BAPTA on Vm (column 1) and pacemaker unit discharge (column 2). The slow wave characteristic metrics are summarized in the bar plot are given in panel I (bars indicate mean value ± SD). Shown are the simulated results for 90% (row 1), 75% (row 2), 25% (row 3), and 0% (row 4) of the original values for μS1S2 and μS2Cy (for all pacemaker units). Low doses of BAPTA cause a significant decrease in pacing frequency and amplitude (row 2), relative to control conditions. Higher concentrations results in uncoordinated pacemaker activity and irregular pacemaker unit discharge (row 3) and abolishment of all pacemaker activity (row 4). Note that low doses of BAPTA have little effect on dVm/dtmax, but increased doses lead to a reduction in the value of this metric (I). This result is extremely important, as it shows pacemaker unit activity is a necessary precursor for slow wave generation.