
Figure 6.
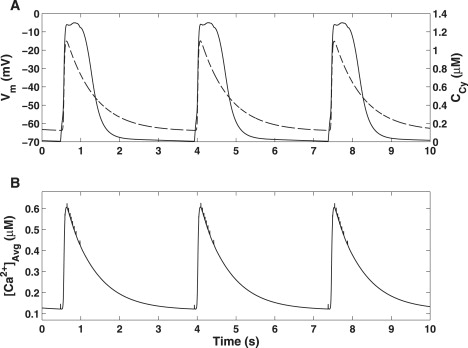
Simulated intracellular Ca2+ oscillations generated by the slow wave model. (A) Vm (solid) and CCy (dashed) traces showing a phase-locked correlation between slow wave activity and Ca2+ oscillations. (B) Spatially averaged [Ca2+] calculated over all cytoplasmic compartmental volumes. Note the spiking activity indicating the Ca2+ hotspots that are generated from ER Ca2+ release.