
Figure 8.
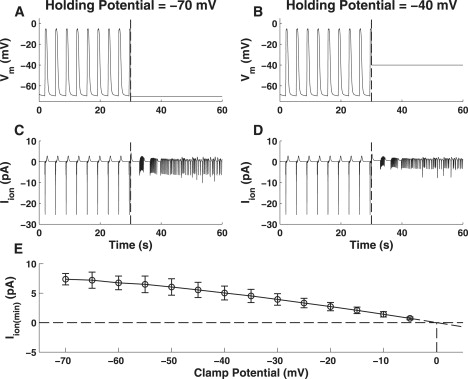
Pacemaker activity produced under simulated voltage-clamp conditions. Illustrated are the Vm (row 1) and clamped membrane currents (row 2) produced for holding potentials of −70 mV (A and B) and −40 mV (C and D). The vertical dashed line at t = 30 s indicates the point where simulated voltage-clamp commences. Note the persistence of pacemaker activity under voltage-clamp, as illustrated by the generation of unitary currents (row 2; t > 30 s). Note also that the magnitude of these unitary currents decreases with depolarization from a holding potential of −70 mV (B) to −40 mV (D). (E) Magnitude of the unitary currents generated under voltage clamp (bars indicated mean ± SD). Extrapolation of this relationship indicates that the unitary currents reverse around 0 mV.