
Figure 8.
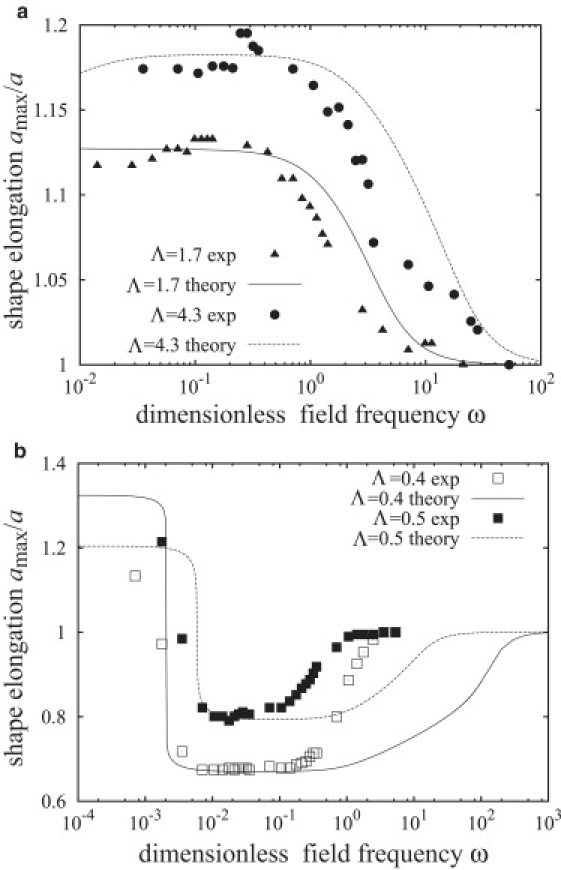
Comparison between theory and the experimental data of Aranda et al. (30). (a) Prolate deformations. The fitted initial tensions are σ0 = 20,000 (corresponding to 1.1 × 10⁻³ mN/m) for Λ = 1.7 and σ0 = 3000 (1.6 × 10⁻⁴ mN/m) for Λ = 4.3. (b) Oblate deformations. The fitted initial tensions are σ0 = 1 (5.6 × 10⁻⁸ mN/m) for Λ = 0.4 and σ0 = 100 (2.5 × 10⁻⁵ mN/m) for Λ = 0.5.