
Figure 1.
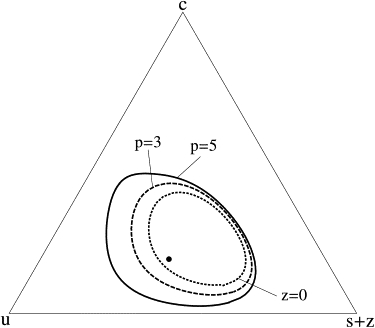
Effect of different saturated-lipid cross-linkers on the boundary of the liquid-liquid two-phase region. The temperature is above that of the main chain transition of the saturated lipid. The dotted line shows the boundary of the two-phase region for a system with no cross-linkers. The dashed and solid lines show the boundaries for concentrations z = 0.03 of cross-linkers with p = 3 and p = 5, respectively. Compositions are plotted in terms of mole fractions of unsaturated lipids (u), cholesterol (c), and total saturated lipids, including cross-linked lipids (s + z). The particular composition of s = 0.37, u = 0.45, and c = 0.18, noted in the text, is shown with a dot. In all cases, the parameters used in Eqs. 3 and 4 are Jss = 1.0, k1 = 1.0, Jus = 1.8, Jcs = 2.4, and k2 = 0.21.