
Figure 4.
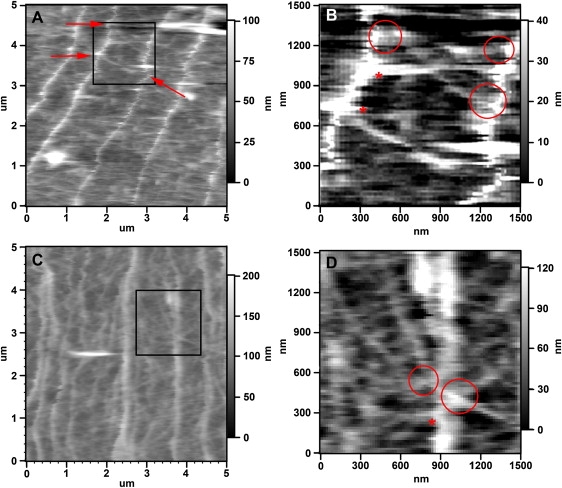
High resolution analysis of filopodial actin bundles and lamellipodial actin networks in the P domain. (A and C) High resolution DM images showing details of the filopodia actin bundles and actin meshwork structures in different growth cones. The filaments in the actin network are less interconnected in A when compared to C. In both images, the individual filaments of the meshwork are thinner and less oriented than the filopodial actin bundle running from top to bottom. (B and D) Magnifications of boxed areas in A and C, respectively. Asterisks indicate potential connections between lamellipodial actin meshwork and filopodial actin bundles. Arrows indicate locations where kinks in bundles correlate with connecting lamellipodial actin structures. Scales are indicated.