
Figure 7.
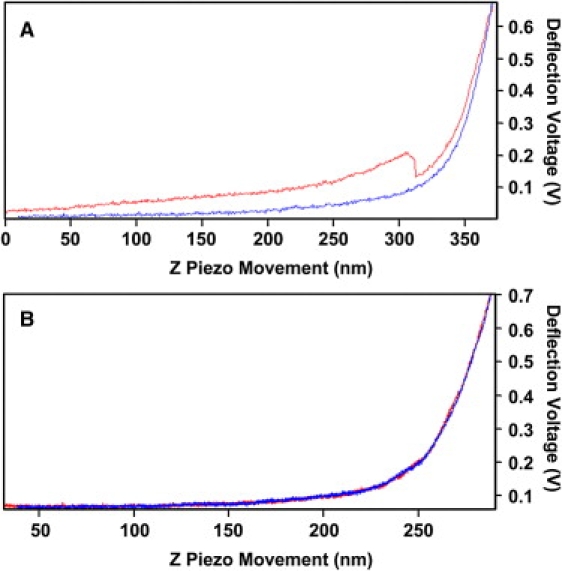
Frequency-dependent hysteresis in the T zone. (A) Force curve measured in the T zone at 1 Hz rate showing hysteresis behavior seen between the approaching (top) and retracting (bottom) parts of the force curve with a sudden decrease in apparent stiffness in the approaching part of the force curve. (B) Force curve measured at 0.1 Hz at the identical position with no apparent hysteresis behavior. The stiffness determined from B is also slightly lower than the one measured from (A).