
Figure 4.
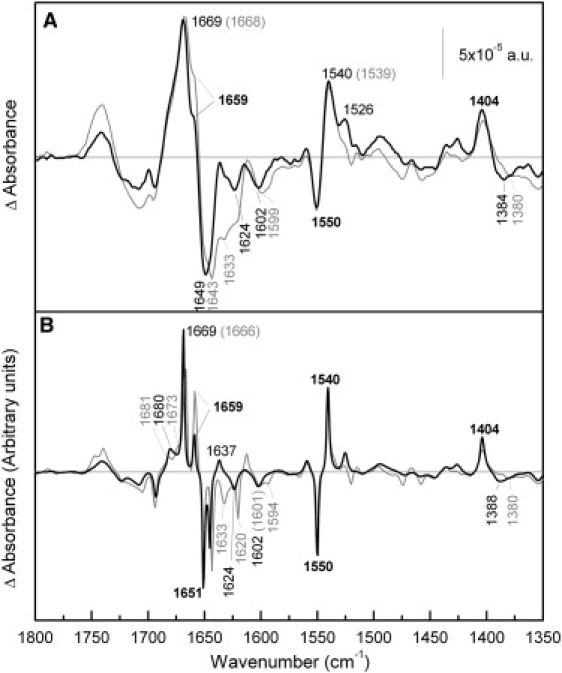
Comparison of melibiose-induced difference spectra of R141C and Cys-less in the presence of H+. (A) Solid line: Difference spectrum of R141C in 20 mM MES, 100 mM KCl, 50 mM melibiose, pH 6.6, minus R141C in 20 mM MES, 100 mM KCl, pH 6.6; shaded line: difference spectrum of MelB Cys-less under the same conditions. (B) Deconvoluted difference spectra of panel A.