
Figure 5.
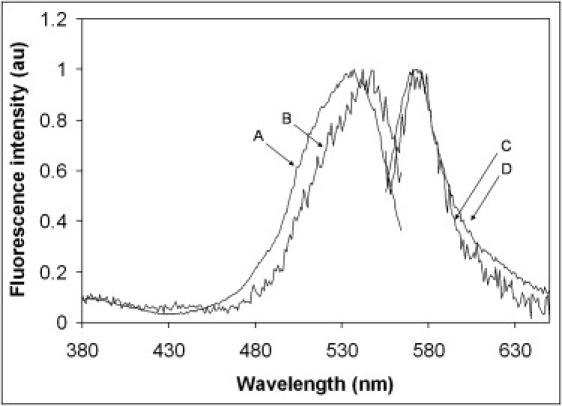
Excitation and emission spectrum of BODIPY TMR-labeled PI(4,5)P2 in GUVs and aggregates. Traces A and D are the normalized excitation and the emission spectrum of the lipid aggregates (100% BODIPY TMR-labeled PI(4,5)P2), respectively. Traces B and C are the normalized excitation and the emission spectrum of GUVs containing 99% POPC and 1% BODIPY TMR-labeled PI(4,5)P2, respectively.