
Figure 5.
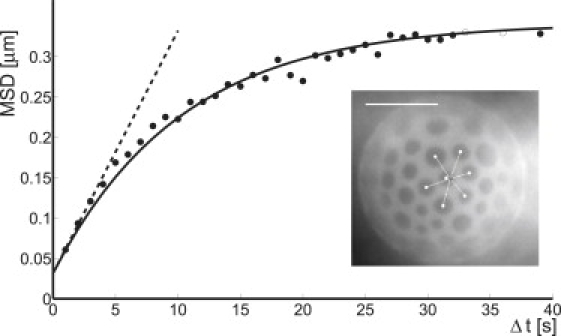
Typical example of the mean-square displacement (msd) of the distance between central domain and center-of-mass of the surrounding domains (dots); (solid line) fit to the Ornstein-Uhlenbeck model (Eq. 16); and (dashed line) linear fit to the first three data points. (Inset) Example for tracking configuration. (Open dots) Centroids of domains; (solid dot) center-of-mass of domains constituting the shell; and (shaded line) vector connecting the centroid of the central domain and the center-of-mass of the shell domains. The msd of this distance is used to determine the diffusional behavior of the central domain. Scale bar, 20 μm.