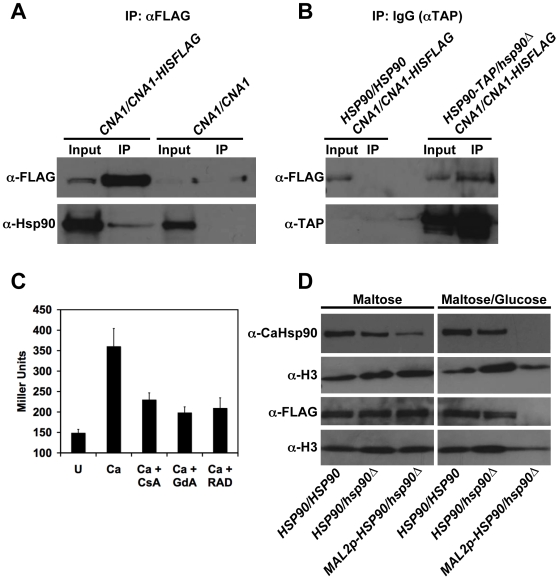
Figure 4. Calcineurin is an Hsp90 client protein in C. albicans.
(A) Hsp90 and calcineurin physically interact as measured by co-immunoprecipitation of Hsp90 with Cna1-HisFLAG. Immunoprecipitation of HisFLAG-tagged Cna1 with anti-FLAG M2 affinity agarose, co-purifies Hsp90. Hsp90 was not immunoprecipitated by anti-FLAG M2 affinity agarose in control cells harboring untagged Cna1. (B) Hsp90 and calcineurin physically interact as measured by the reciprocal co-immunoprecipitation of Cna1-HisFLAG with Hsp90-TAP. Immunoprecipitation of Hsp90-TAP with IgG agarose, co-purifies Cna1-HisFLAG. Cna1-HisFLAG was not immunoprecipitated by IgG agarose in control cells harboring untagged Hsp90. (C) Calcineurin activation is blocked by pharmacological inhibition of Hsp90. A strain harboring a UTR2p-lacZ construct was incubated in rich medium with no treatment (U) or with 0.2 M CaCl2 (Ca) to activate calcineurin. The impact of the calcineurin inhibitor CsA (10 µM), or the Hsp90 inhibitors GdA (5 µM) or RAD (5 µM) on calcineurin activation was determined by measurement of β-galactosidase activity. Data are means±standard deviations for triplicate samples. (D) Genetic reduction of Hsp90 levels results in depletion of calcineurin. All strains shown in this panel have one allele of Cna1-HisFLAG in addition to the indicated genotype. Even when fully induced in the maltose, expression of Hsp90 from the MAL2 promoter is not as strong as from the native promoter, while glucose results in further reduction of Hsp90 expression. This reduction of Hsp90 levels is accompanied by depletion of calcineurin. Top two panels, immune blot analysis of Hsp90 levels relative to the histone H3 loading control (5 µg protein loaded per well). Bottom two panels, immune blot analysis of Cna1-HisFLAG relative to the histone H3 loading control (50 µg protein loaded per well).

