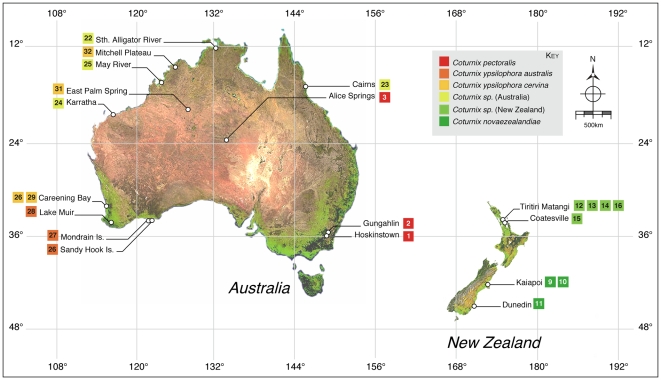
Figure 2. Coturnix sp. samples used for which location data were available.
Nearest location to samples used are shown. Numbers correspond to those shown in Table 1. Each square represents a single sample. Colours delineate species and sub-species (see Key).

