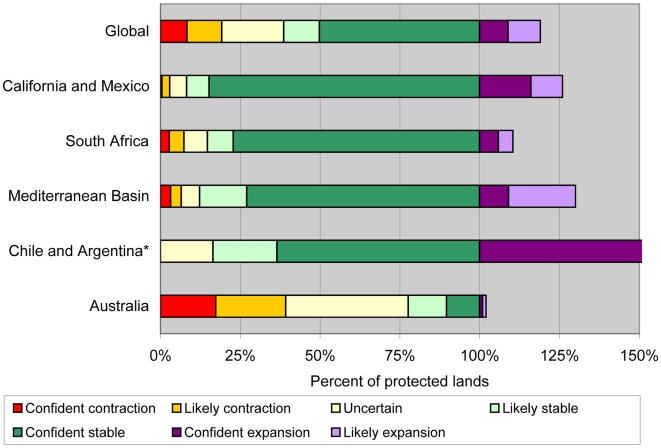
Figure 4. Projected future status of the MCE on protected lands under the high (A2) emissions scenario.
The percentages indicate the portion of the current protected lands within the current MCE. There is over 5 times the amount of protected area in the confident and likely expansion area in Chile and Argentina relative to the amount in the current MCE, but the full extent is not shown in the chart to show more detail in the other regions.

