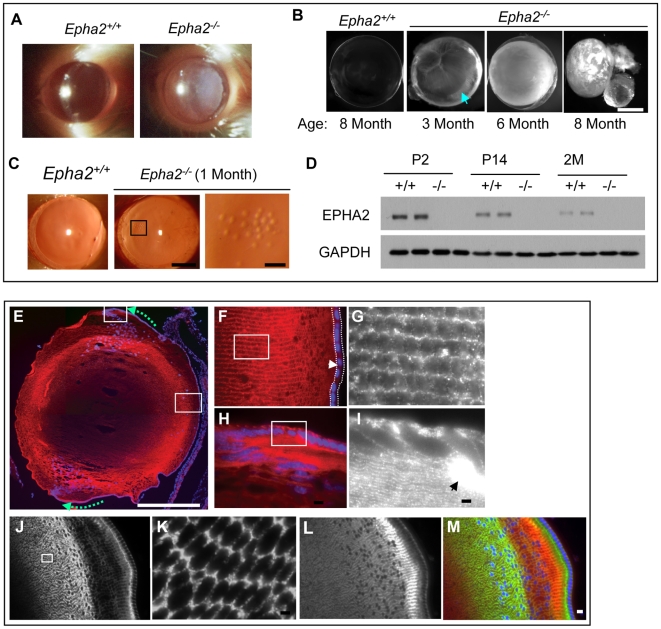
Figure 1. Development of progressive cataract in Epha2 knockout mice and characterization of spatial and temporal regulation of EPHA2 expression in the lens.
(A–C) Epha2 homozygous deletion in mice causes development of progressive cataract. (A) Cataracts were visible by gross inspection in homozygous Epha2 knockout mice (Epha2−/−) between 5 to 8 months of age, but not in heterozygous or wild type mice. Shown are slit lamp images confirming development of cataract in Epha2−/− but not Epha2+/+ mice. (B) Dark field imaging of the dissected lens. Although not readily detectable by visual inspection, cataracts were found on dissected lens by 3 months of age. This lens was tilted to show denser opacity near the equator (arrow). Enucleation frequently occurred during dissection of mature cataract after 8 months (far right). (C) Retroillumination examination revealed clusters of small vacuoles by one month of age. Scale bars: 1 mm for middle panel; 150 µm for right panel. (D) Immunoblot of total lens lysates showing decreasing EPHA2 expression with aging. (E–M) Compartmentalized and gradient expression of EPHA2 (red) in mouse lens. Blue: DAPI nuclear staining. (E–I) Midsagittal sections of lens from 14-day-old wild type mice were stained for EPHA2. (E) Low power view of an entire lens revealed dense expression of EPHA2 in subcortical lens fiber cells. Dotted arrows indicate gradient expression in lens epithelial cells near the equator. Scale bar: 1 mm. (F) Low EPHA2 expression in anterior lens epithelial cells (arrow head, sandwiched between dotted lines). (G) Inset from (F) showing high EPHA2 expression in lens fiber cells. (H) High level of EPHA2 expression at the bow. (I) Inset from (H) showing dense expression at modulus (arrow). Scale bars: 5 µm for F–I. (J–M) Coronal sections through the bow region of lens co-stained for EPHA2 and N-cadherin. (J) Note the spatially regulated expression pattern in subcortical lens fiber cells. (K) Inset from (J) showing “honey-comb” membrane staining pattern of EPHA2 in the cross sections of fiber cells at high magnifications. (L) N-cadherin from the same section show overlapping but distinct expression pattern compared with that of EPHA2. (M) Merged images of EPHA2/N-cadherin. 10 µm for J, L, and M; 2 µm for K.

