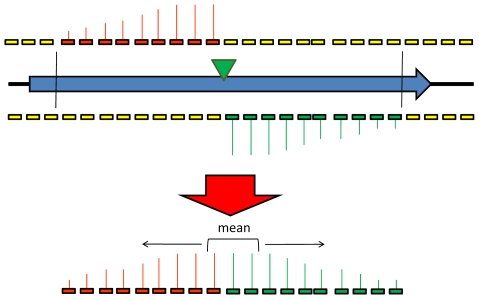
Figure 2. Diagrammatic representation of the TMDH scoring system.
The most likely position of the transposon is inferred from the microarray data, and the probes that would detect the signals from a transposon in that position are identified. To summarize the signals of these probes into a single data point, a sliding window approach is used. The geometric mean of the signals is determined for each consecutive set of 3 probes. The highest such value is used to represent the signal for that restriction fragment.

