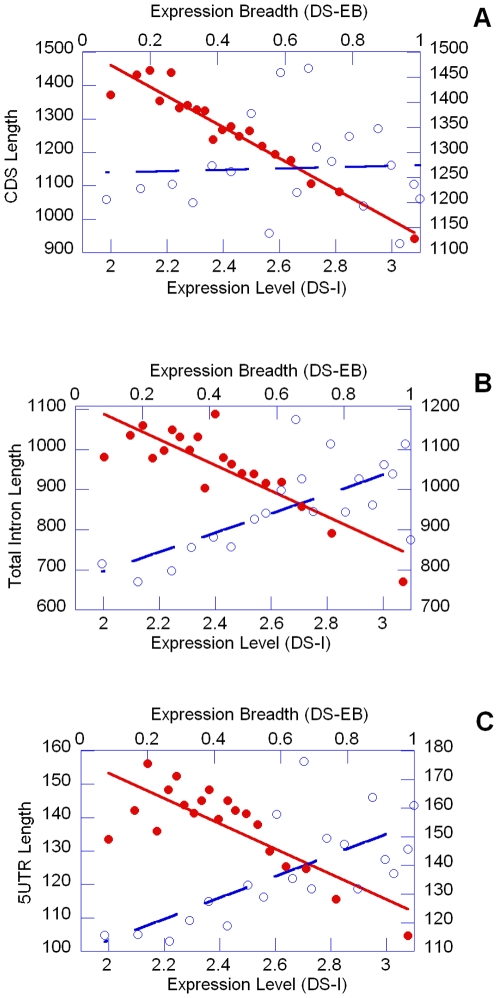
Figure 2. Relationship between the expression profile and (a) the CDS length, (b) the Total Intron Length and (c) 5utr Length.
The points indicated by the symbol • and interpolated by the continuous line refer to the expression level, whereas the points indicated by the symbol ○ and interpolated by a dashed line refer to the expression breadth. In both cases 14236 genes were considered which have been grouped in bins, each representing the 5% of the whole dataset.

