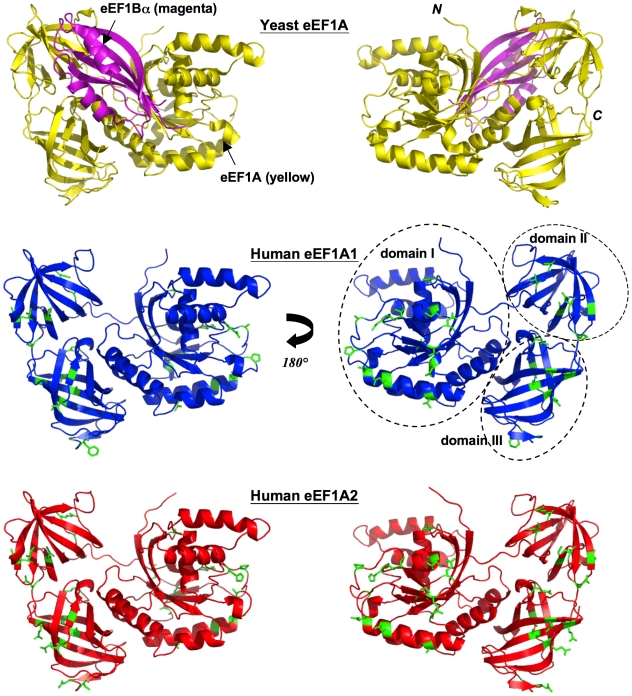
Figure 2. Yeast template, human eEF1A1 and eEF1A2 models.
Two views rotated by 180° about the y-axis depicting cartoon schematic representations of: the yeast eEF1A (yellow)-eEF1Bα C-terminal fragment (magenta) crystal structure (top panel). The 3-D models of eEF1A1 (blue, middle panel), and eEF1A2 (red, lower panel) show the location of variant side-chains (in stick representation) between the two proteins, colored green. Secondary structure elements have been assigned by default settings in PyMol (http://www.pymol.org) and position of domains labeled.

