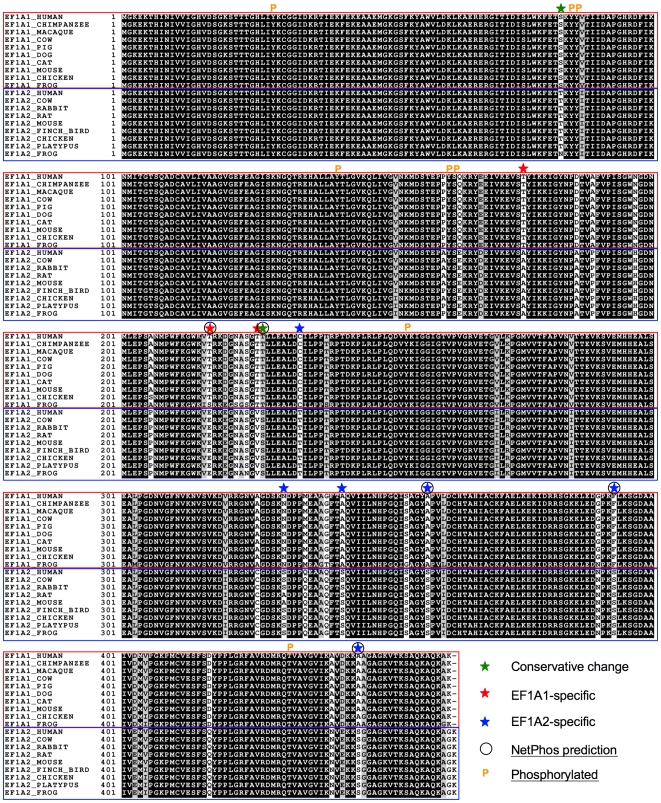
Figure 4. Multiple sequence alignment of eEF1A1 and eEF1A2 orthologues.
ClustalX alignment of eEF1A1 and eEF1A2 sequences from a range of higher order eukaryotes. The results are shaded using BOXSHADE v3.21 (black background = strictly conserved; grey or white background = conservatively substituted or non-conserved). A star-symbol denotes the position of variant Ser and Thr amino acid residues for the two proteins and color-coded according to variant (red = eEF1A1-specific; blue = eEF1A2-specific). NetPhos-predicted phosphorylation sites are indicated by a circle, and experimentally determined phosphorylation sites shown with a ‘P’ symbol (these are mapped on the models in Supplementary file S6).

