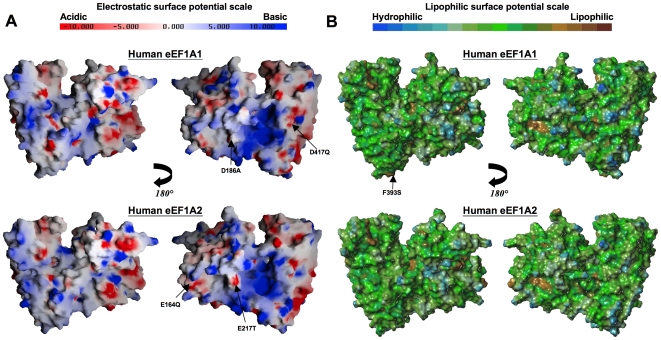
Figure 5. Surface properties of the models eEF1A1 and eEF1A2.
(A) Two equivalent views, rotated by 180° about the y-axis, of a GRASP-generated [56] surface electrostatic representation of eEF1A1 (upper panel) and eEF1A2 (lower panel). Negative charge is colored red and positive charge colored blue, ranging from -10 kT to +10 kT (k = Boltzmann's constant; T = temperature in Kelvin). Charged residues not present in either protein (non-conservative charged substitutions only) are labeled – the variant equivalent residue is shown on the right-hand side of the label. (B) Two equivalent views, rotated by 180° about the y-axis, of a MOLCAD-generated [57] lipophilic surface rendition of the models. Regions of high lipophilicity or hydrophobicity are colored brown and regions of high hydrophilicity are colored blue.

