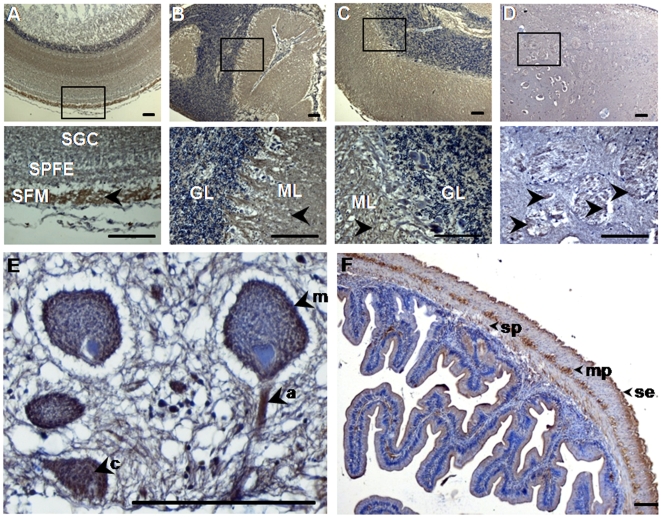
Figure 1. Normal PrPC distribution in CNS and peripheral tissues.
Sagittal, 4 µm-thick brain and intestine sections from control fish were treated with SaurPrP1 (1∶2000 and 1∶250, respectively) and normal endogenous PrP labeling in different anatomical regions was examined. A, Optic tectum; B, Valvula cerebelli; C, Corpus cerebelli; D, Nerve fibers in diencephalon; E, Neurons in brainstem; F, PrP-immunoreactive areas in the intestine. Rectangles indicate areas of magnification shown in the panel directly below. Arrowheads show positively stained regions. SGC, striatum griseum centrale; SPFE, striatum plexiforme et fibrosum externum; SFM, striatum fibrosum marginale; ML, molecular layer; GL, granular layer, m, plasma membrane; a, axon; c, cytoplasm. se, serosa; mp, myenteric plexus; sp, submucous plexus. Scale bars, 100 µm.

