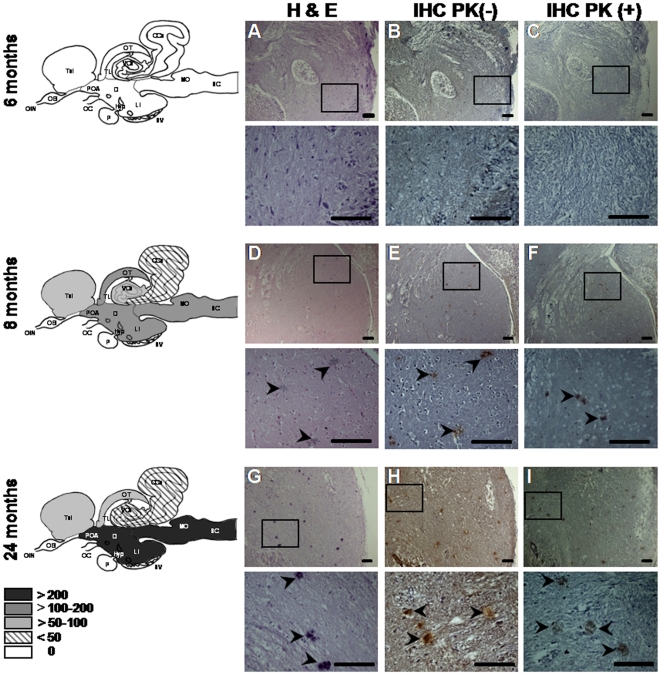
Figure 3. Progression of abnormal deposition in BSE-challenged fish.
Sagittal brain sections from BSE-challenged fish taken at the indicated times p.i. were stained with H&E (A, D, G), or immunolabeled with SaurPrP1 (1∶2000) without PK-digestion (B, E, H) and with PK-digestion (C, F, I). Images show diencephalon. The mean number of deposits (per section of fish containing deposits) observed in different brain regions without PK-treatment is indicated by the fill-type in the schematic drawings at the far left. Abbreviations as in Figure 2. The following areas were not examined: OB; OIN; OC; P. Rectangles indicate areas of magnification shown in the panels directly below. Arrowheads indicate the abnormal aggregates. Scale bars, 100 µm.

