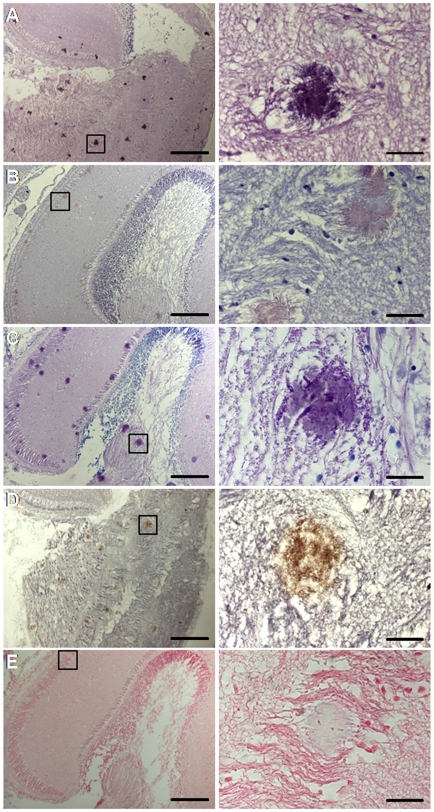
Figure 7. Staining of an aggregate in the brain of a BSE-challenged fish 24 months p.i. with different techniques.
A, H&E; B, Congo red in normal light; C, PAS; D, IHC (SaurPrP1) after PK-digestion; E, Alcian blue. Rectangles in the left panel indicate areas of magnification shown in the right panel. Scale bars, 100 µm (left panel) or 10 µm (right panel).

