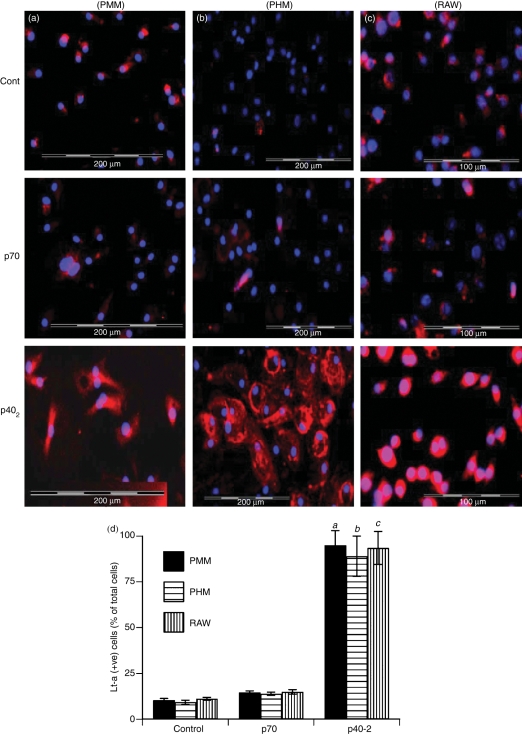
Figure 3.
Effect of p402 and p70 on the expression of lymphotoxin-α (Lt-α) protein in different cell types. Microglia (PMM) isolated from 7- to 9-day-old mouse pups (a), microglia (PHM) isolated from 13- to 17-week-old human fetal brains (b) and RAW 264.7 cells (c) were stimulated with 10 ng/ml p402 and p70 separately under the serum-free condition. After 18 hr of stimulation, the expression of Lt-α protein was monitored by immunofluorescence. DAPI was used to visualize the nucleus. Figures show merged images of DAPI and Lt-α. (d) Lt-α-positive cells were counted in three different slides of each of three different experiments in an Olympus IX81 fluorescence microscope using the microsuite imaging software and are expressed as % total DAPI-positive cells. aP < 0·001 versus control for PMM; bP< 0·001 versus control for PHM; cP < 0·001 versus control for RAW cells.

