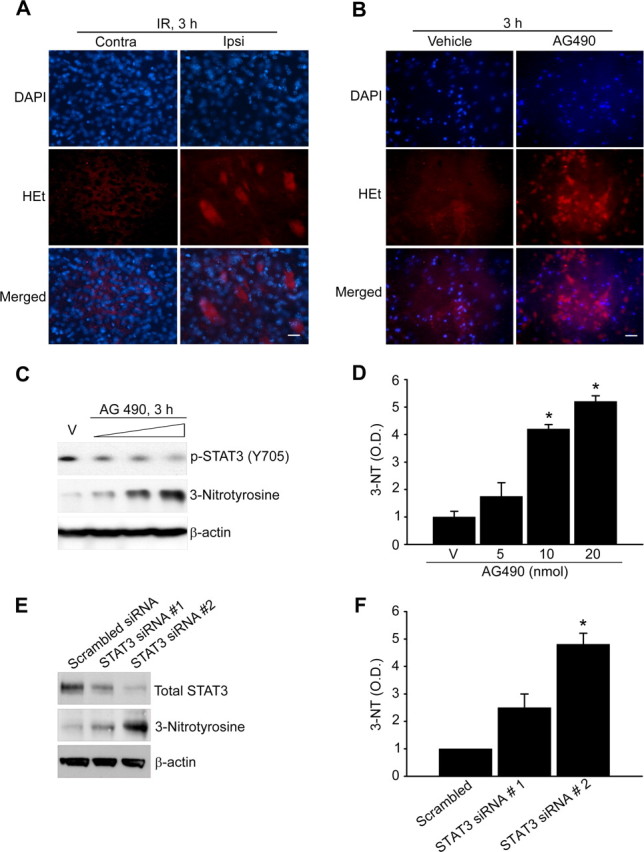
Figure 7.

Inhibition of STAT3 by ischemic reperfusion increases generation of O2·−. A, ROS production shown by HEt (red) and 4′,6-diamidino-2-phenylindole (DAPI, blue) staining of ischemic regions (cortex) on the contralateral and ipsilateral sides. Scale bar, 20 μm. B, ROS production shown by HEt (red) and DAPI (blue) staining of primary cortical neurons treated with 50 μm AG490 for 3 h. Scale bar, 20 μm. C, Protein nitrosylation was quantified from Western blots using a 3-nitrotyrosine antibody. Whole-cell protein extracts (30 μg) were obtained from the cerebral cortex and caudate–putamen (except the hippocampus) of male mouse brains injected intracerebroventricularly with the vehicle (V) (50% DMSO in PBS) or AG490 (5 nmol, 10 nmol, and 20 nmol in 50% DMSO in PBS). D, Summary graph depicting changes in 3-nitrotyrosine relative to total protein loading. *p < 0.05 (n = 4 per group). E, Protein nitrosylation was quantified from Western blots using a 3-nitrotyrosine antibody. Whole-cell protein extracts (30 μg) from primary cortical neurons were transfected with STAT3-specific siRNA for 24 h. Transfection efficiency of STAT3-specific siRNA was determined by Western blot analysis using a total STAT3 antibody. F, Summary graph depicting the changes in 3-nitrotyrosine relative to total protein loading. *p < 0.05 (n = 4 per group). O.D., Optical density.
