
Figure 4.
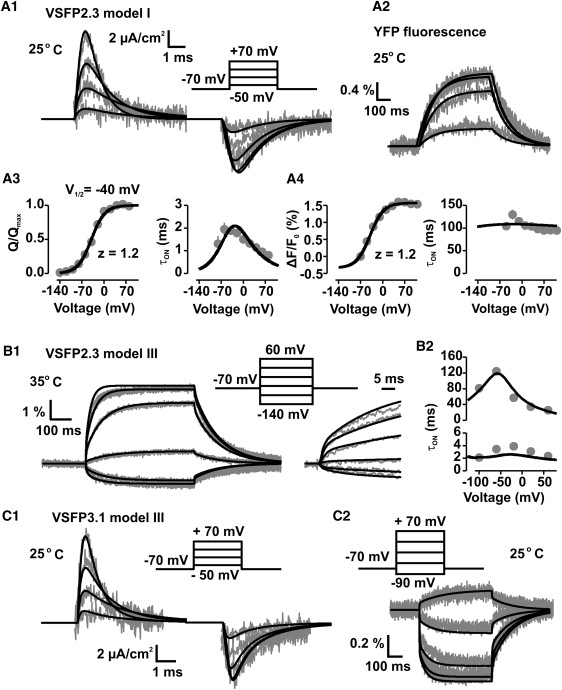
Kinetics of charge transfer and fluorescence response of the voltage-sensitive fluorescent proteins VSFP2.3 and VSFP3.1. Experimental data measured from PC12 cells expressing these proteins (gray) are overlaid with the predictions obtained from the simulation models (black). (A1) Sensing currents of VSFP2.3 measured at 25° and evoked by the voltage-step protocol given as inset with 40 mV step depolarizations (20 ms) from a holding potential of −70 mV, together with simulated traces using model I. The finite response time of the experimental voltage clamp was accounted for in the simulations by a 150 μs charging time constant. (A2) Fluorescence response (ΔF/F0) recorded together with the traces in (A1) using same voltage steps, but 500 ms step durations. The traces refer to the emission by YFP of the cyan/yellow FP reporter pair. (A3) Normalized steady-state charge transfer (Q/Qmax; left panel) and ON time constant (τON; right panel) obtained for VSFP2.3 and model I. (A4) Normalized fluorescence response amplitude ΔF/F0 (left panel) and fluorescence ON time constant (right panel) derived from the recordings in (A2) and model I. (B1) YFP fluorescence responses of VSFP2.3 recorded at 35° and averaged over 10 cells, together with simulated traces using model III. (B2) Fluorescence ON time constants derived from dual-exponential fits of the traces shown in (B1). (C1) Sensing currents of VSFP3.1 measured at 25° with the voltage-step protocol given as inset (same as in A1), together with simulated traces using model III including a 150 μs charging time constant. (C2) Fluorescence response (ΔF/F0) recorded together with the traces in (C1) using same voltage steps, but 500 ms step durations. The traces refer to the emission by cyan fluorescent protein.