
Figure 1.
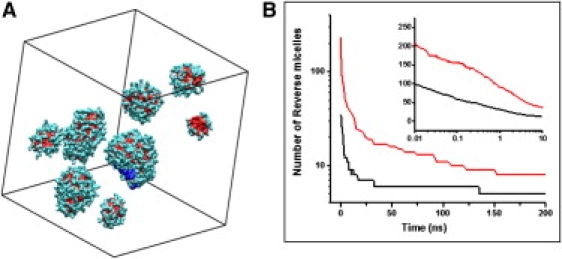
(A) Image of the final configuration showing RM of the w0 = 11 simulation. The peptide encapsulated in the largest RM is colored blue to ease the view. (B) Number of RM along the simulation trajectory. The inset shows the number of RM versus log(t) for short times, black for w0 = 6 and red for w0 = 11.