
Figure 3.
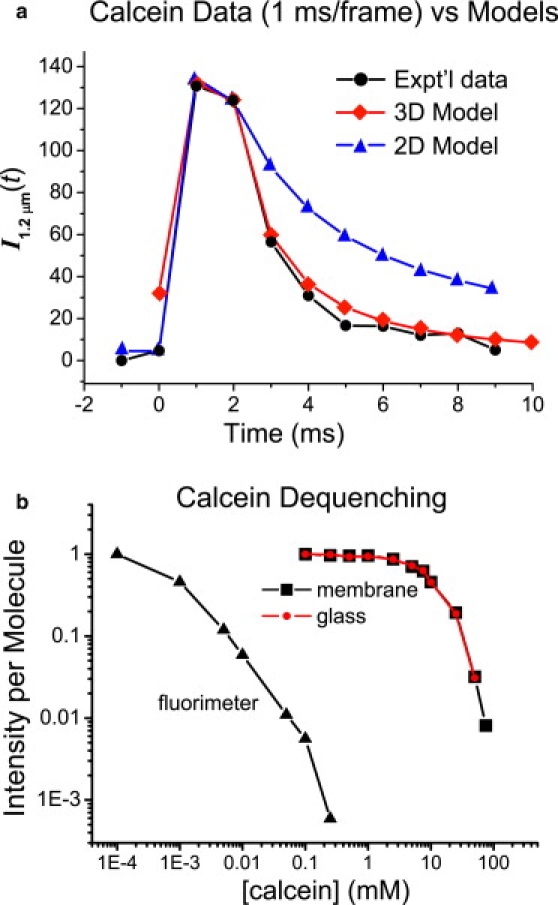
(a) Comparison of integrated calcein fluorescence intensity trace I1.2 μm (t) from 1 ms, two-color movies with 3D and 2D diffusion model calculations using Dcalcein = 200 μm2/s in both cases. See text and the Supporting Material for details. (b) Relative intensity per calcein molecule versus [calcein] from fluorimeter and TIRF measurements. The TIRF measurements were the same on hydrophilic glass (circles) and hydrophilic glass covered by a supported lipid bilayer of 2% DOPS and 98% POPC (squares). See text for details.