
Figure 2.
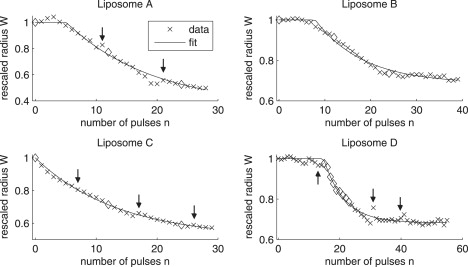
Examples of experimental data and corresponding fits for DOPC liposomes. (Top left) Liposome A; fit results are Nc = 6, λ = 0.13, and Wcfit = 0.35. (Top right) Liposome B; fit results are Nc = 9, λ = 0.19, and Wcfit = 0.69. (Bottom left) Liposome C; fit results are Nc = 1, λ = 0.15, and Wcfit = 0.51. (Bottom right) Liposome D; fit results are Nc = 16, λ = 0.30, and Wcfit = 0.68. Pulse magnitudes are 290, 360, 235, and 300 V/cm, respectively. Pulse duration is 5 ms. Arrows, if present, indicate data just before which we had to recenter the image on the liposome of interest. There is thus a time interval of ≈10 s before the indicated point, instead of 2 s as in all other cases.