
Figure 4.
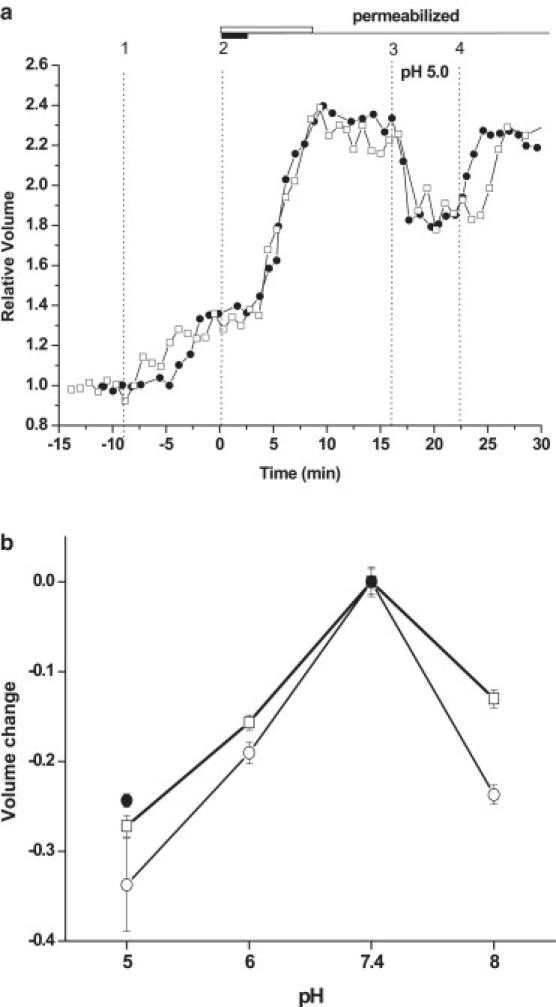
(a) Time-course of two representative experiments showing effect of external pH changes on permeabilized cell volume. Vertical lines indicate: change of external solution from PS to ILS (1); plasma membrane permeabilization with digitonin (5 μg/ml, 2 min) (●) or amphotericin B (8 min, 7.5 μM) (□) (2). The thick horizontal bars denote the duration of detergent treatment: white = Amphotericin B, black = digitonin (3); change of external pH from 7.4 to 5.0 (4); return to pH 7.4. (b) Comparison of pH-dependent volume changes of permeabilized cells in ILS (○); in ILS + 200 mM mannitol (●) and of intact A549 cells (□). The graph shows the difference between relative volume at pH = X and that observed at pH 7.4 according to the formula: volume change = VX/V0 – V7.4/V0, where V0 = initial volume of intact cell in PS, pH 7.4; V7.4 = volume of intact or permeabilized cell in ILS, pH 7.4; and VX = volume of intact or permeabilzed cell at pH = X. Data points are the average (± SE) from 5 to 50 independent experiments for each condition.